Know the crypto regime before you size the trade.
Direction and volatility, distilled into one read across 115 crypto assets. The Market Quality Number (MQN) tells you which of 20 market types you're in — and how to act on it.
The 20 market types
Direction × Volatility
Five MQN direction bands cross four ATR%-based volatility bands to give 20 market types. Read down for direction, across for volatility — the cell you land in tells you whether to lean risk-on, chop, or risk-off.
| Direction ↓ / Vol → | Quiet | Normal | Volatile | Supervolatile |
|---|---|---|---|---|
| SuperbullishMQN ≥ 1.47 | Superbullish / Quiet MQN ≥ 1.47 ATR z < −0.5 | Superbullish / Normal MQN ≥ 1.47 −0.5 to 0.5 | Superbullish / Volatile MQN ≥ 1.47 0.5 to 3.0 | Superbullish / Supervolatile MQN ≥ 1.47 z > 3.0 |
| Bullish0.70 – 1.47 | Bullish / Quiet 0.70 – 1.47 ATR z < −0.5 | Bullish / Normal 0.70 – 1.47 −0.5 to 0.5 | Bullish / Volatile 0.70 – 1.47 0.5 to 3.0 | Bullish / Supervolatile 0.70 – 1.47 z > 3.0 |
| Neutral0 – 0.70 | Neutral / Quiet 0 – 0.70 ATR z < −0.5 | Neutral / Normal 0 – 0.70 −0.5 to 0.5 | Neutral / Volatile 0 – 0.70 0.5 to 3.0 | Neutral / Supervolatile 0 – 0.70 z > 3.0 |
| Bearish0 to −0.70 | Bearish / Quiet 0 to −0.70 ATR z < −0.5 | Bearish / Normal 0 to −0.70 −0.5 to 0.5 | Bearish / Volatile 0 to −0.70 0.5 to 3.0 | Bearish / Supervolatile 0 to −0.70 z > 3.0 |
| Superbearish< −0.70 | Superbearish / Quiet < −0.70 ATR z < −0.5 | Superbearish / Normal < −0.70 −0.5 to 0.5 | Superbearish / Volatile < −0.70 0.5 to 3.0 | Superbearish / Supervolatile < −0.70 z > 3.0 |
Risk-onChop / neutralRisk-offHeavier border = higher volatility
Live dashboard
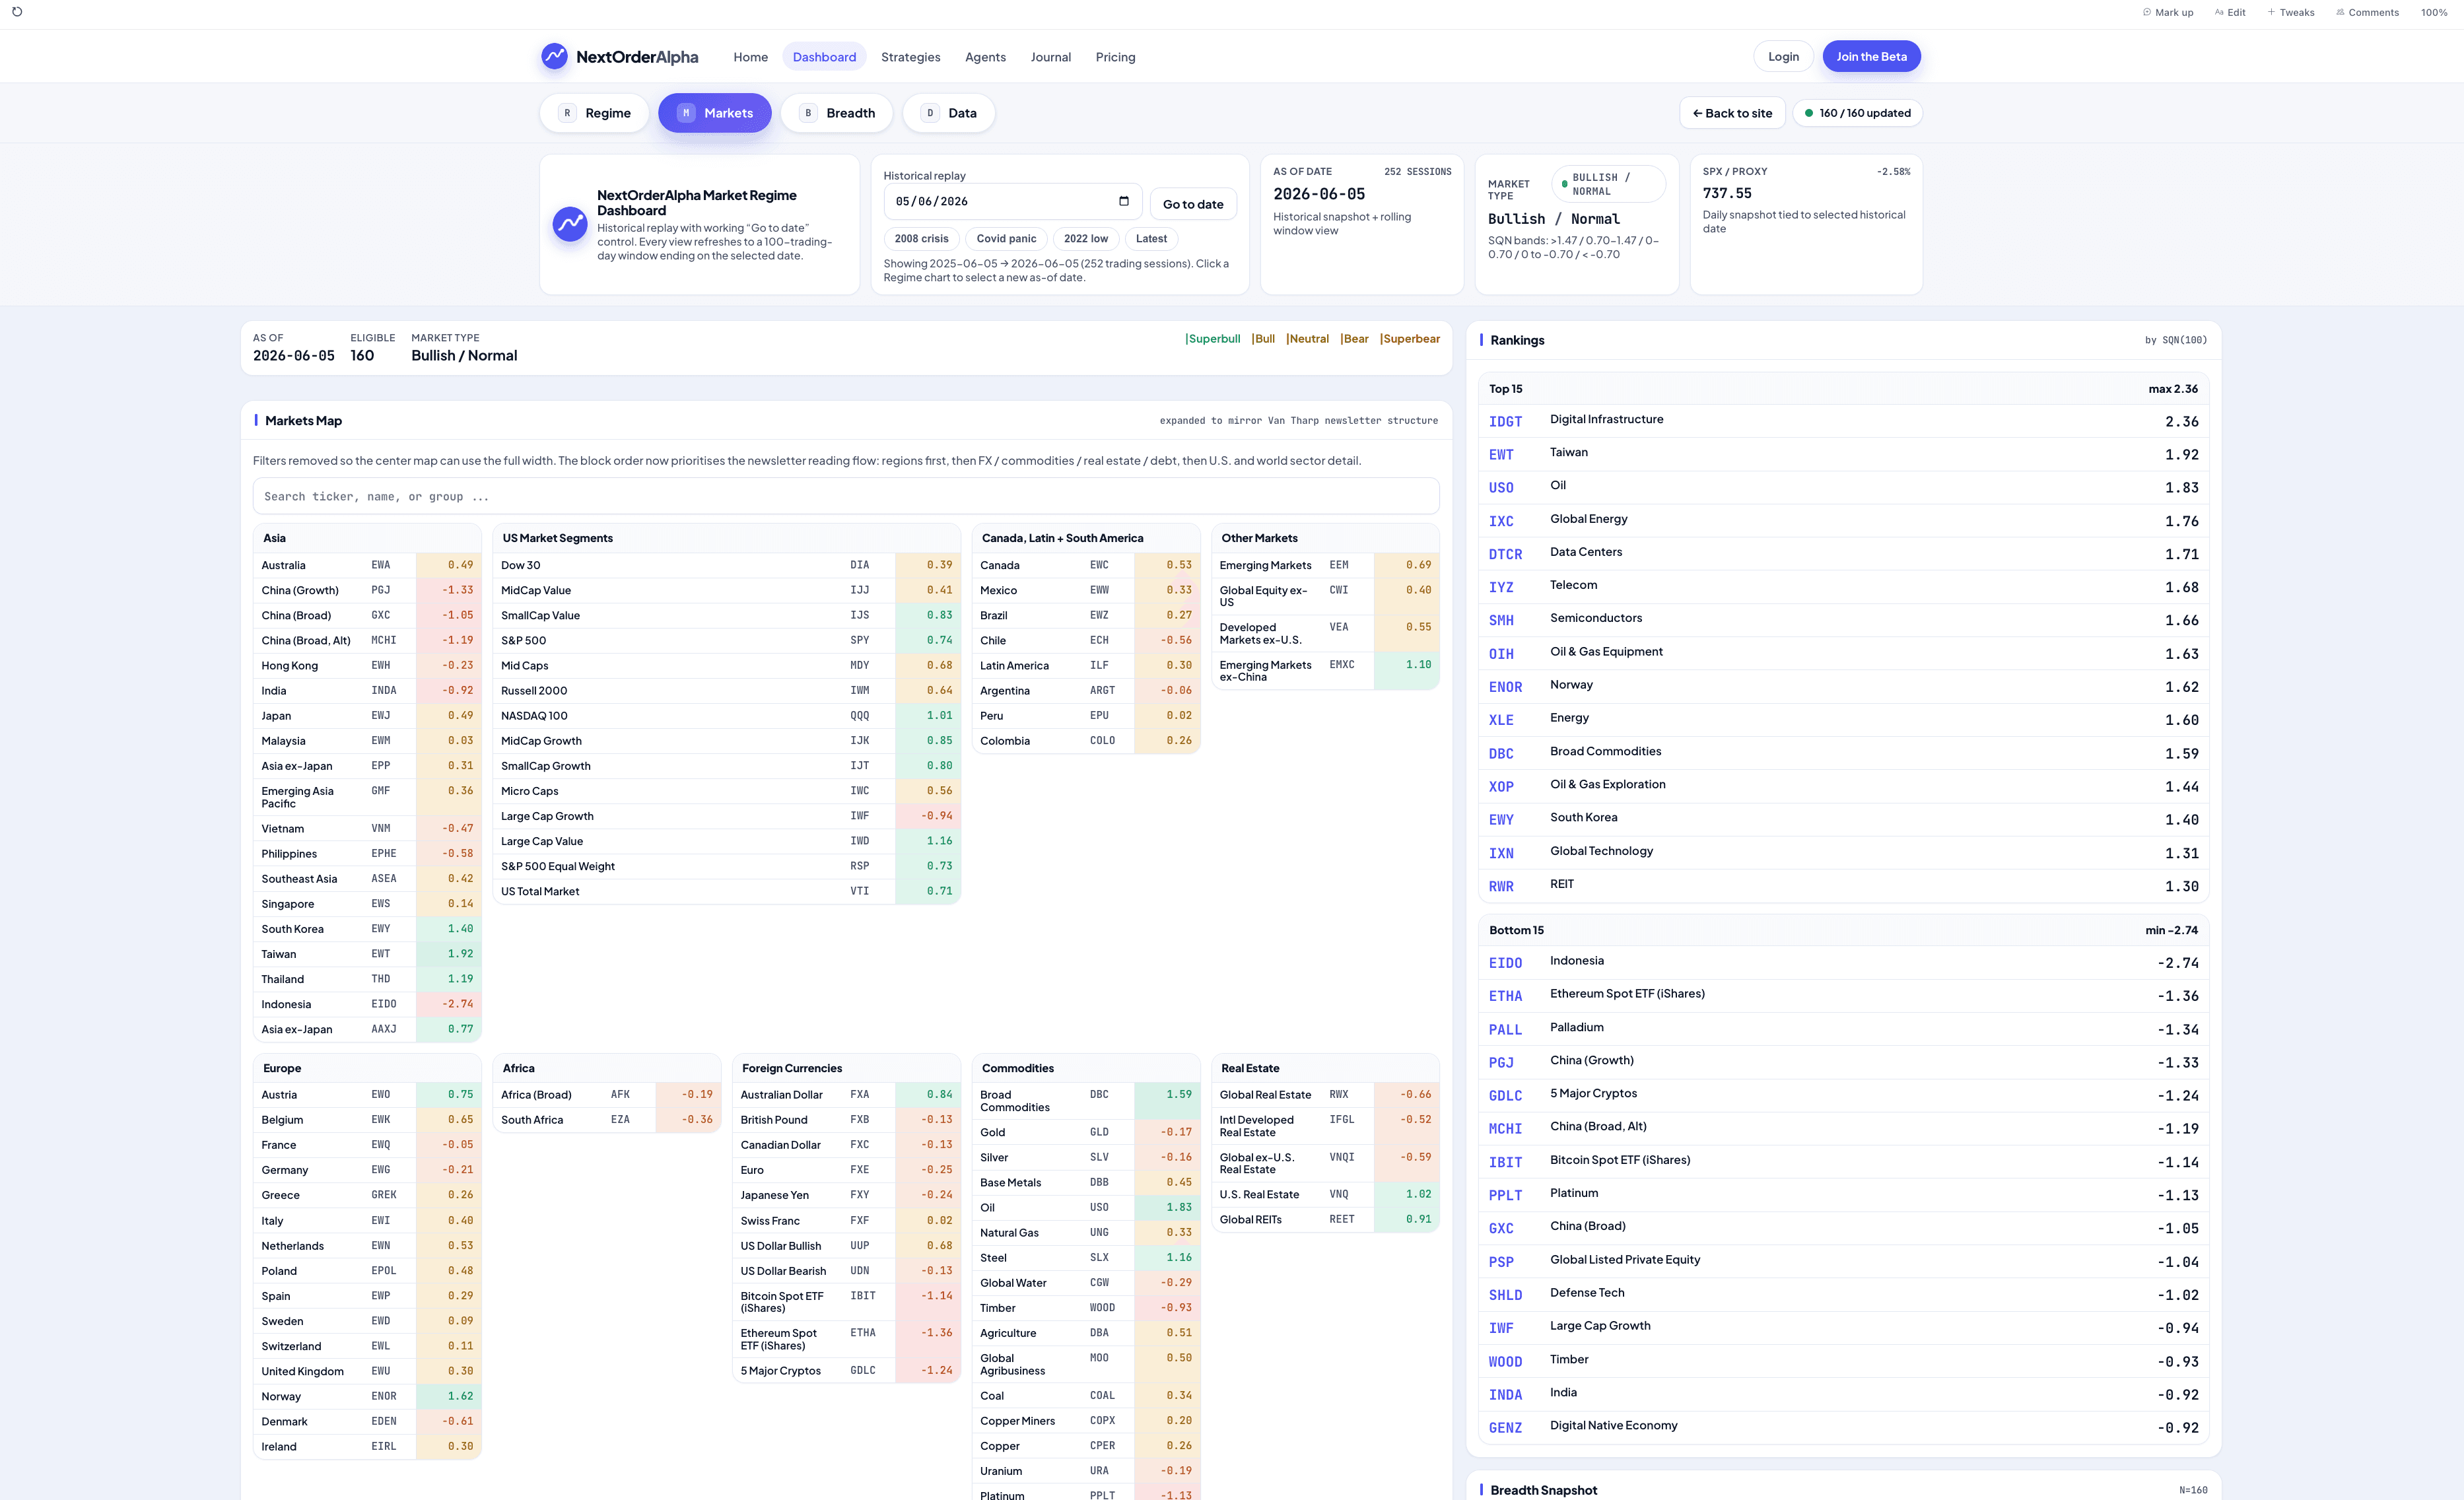
The whole regime, one screen.
The full Dashboards show the MQN(100) direction chart with threshold bands, ATR% volatility, the markets map, breadth and data health — with historical replay back through every regime.
GDLC price252 sessions · Tiingo close
Educational market classification — informational only, not investment advice. Public data is delayed by one session.
See the regime live.
Open the SPY & Crypto Dashboards — MQN, volatility, breadth and the market map, with historical replay.