How many boats are actually rising?
A regime can look strong on the index and hollow underneath. Breadth shows the participation behind the move — the share of the universe in each MQN band, plus trend and new-high/low internals.
Read it with the matrix
Breadth confirms the regime
When most of the universe sits in the green columns, the regime is broad and healthy. When strength narrows to a few names while the matrix still reads bullish, that's your early warning.
| Direction ↓ / Vol → | Quiet | Normal | Volatile | Supervolatile |
|---|---|---|---|---|
| SuperbullishMQN ≥ 1.47 | Superbullish / Quiet | Superbullish / Normal | Superbullish / Volatile | Superbullish / Supervolatile |
| Bullish0.70 – 1.47 | Bullish / Quiet | Bullish / Normal | Bullish / Volatile | Bullish / Supervolatile |
| Neutral0 – 0.70 | Neutral / Quiet | Neutral / Normal | Neutral / Volatile | Neutral / Supervolatile |
| Bearish0 to −0.70 | Bearish / Quiet | Bearish / Normal | Bearish / Volatile | Bearish / Supervolatile |
| Superbearish< −0.70 | Superbearish / Quiet | Superbearish / Normal | Superbearish / Volatile | Superbearish / Supervolatile |
Live dashboard
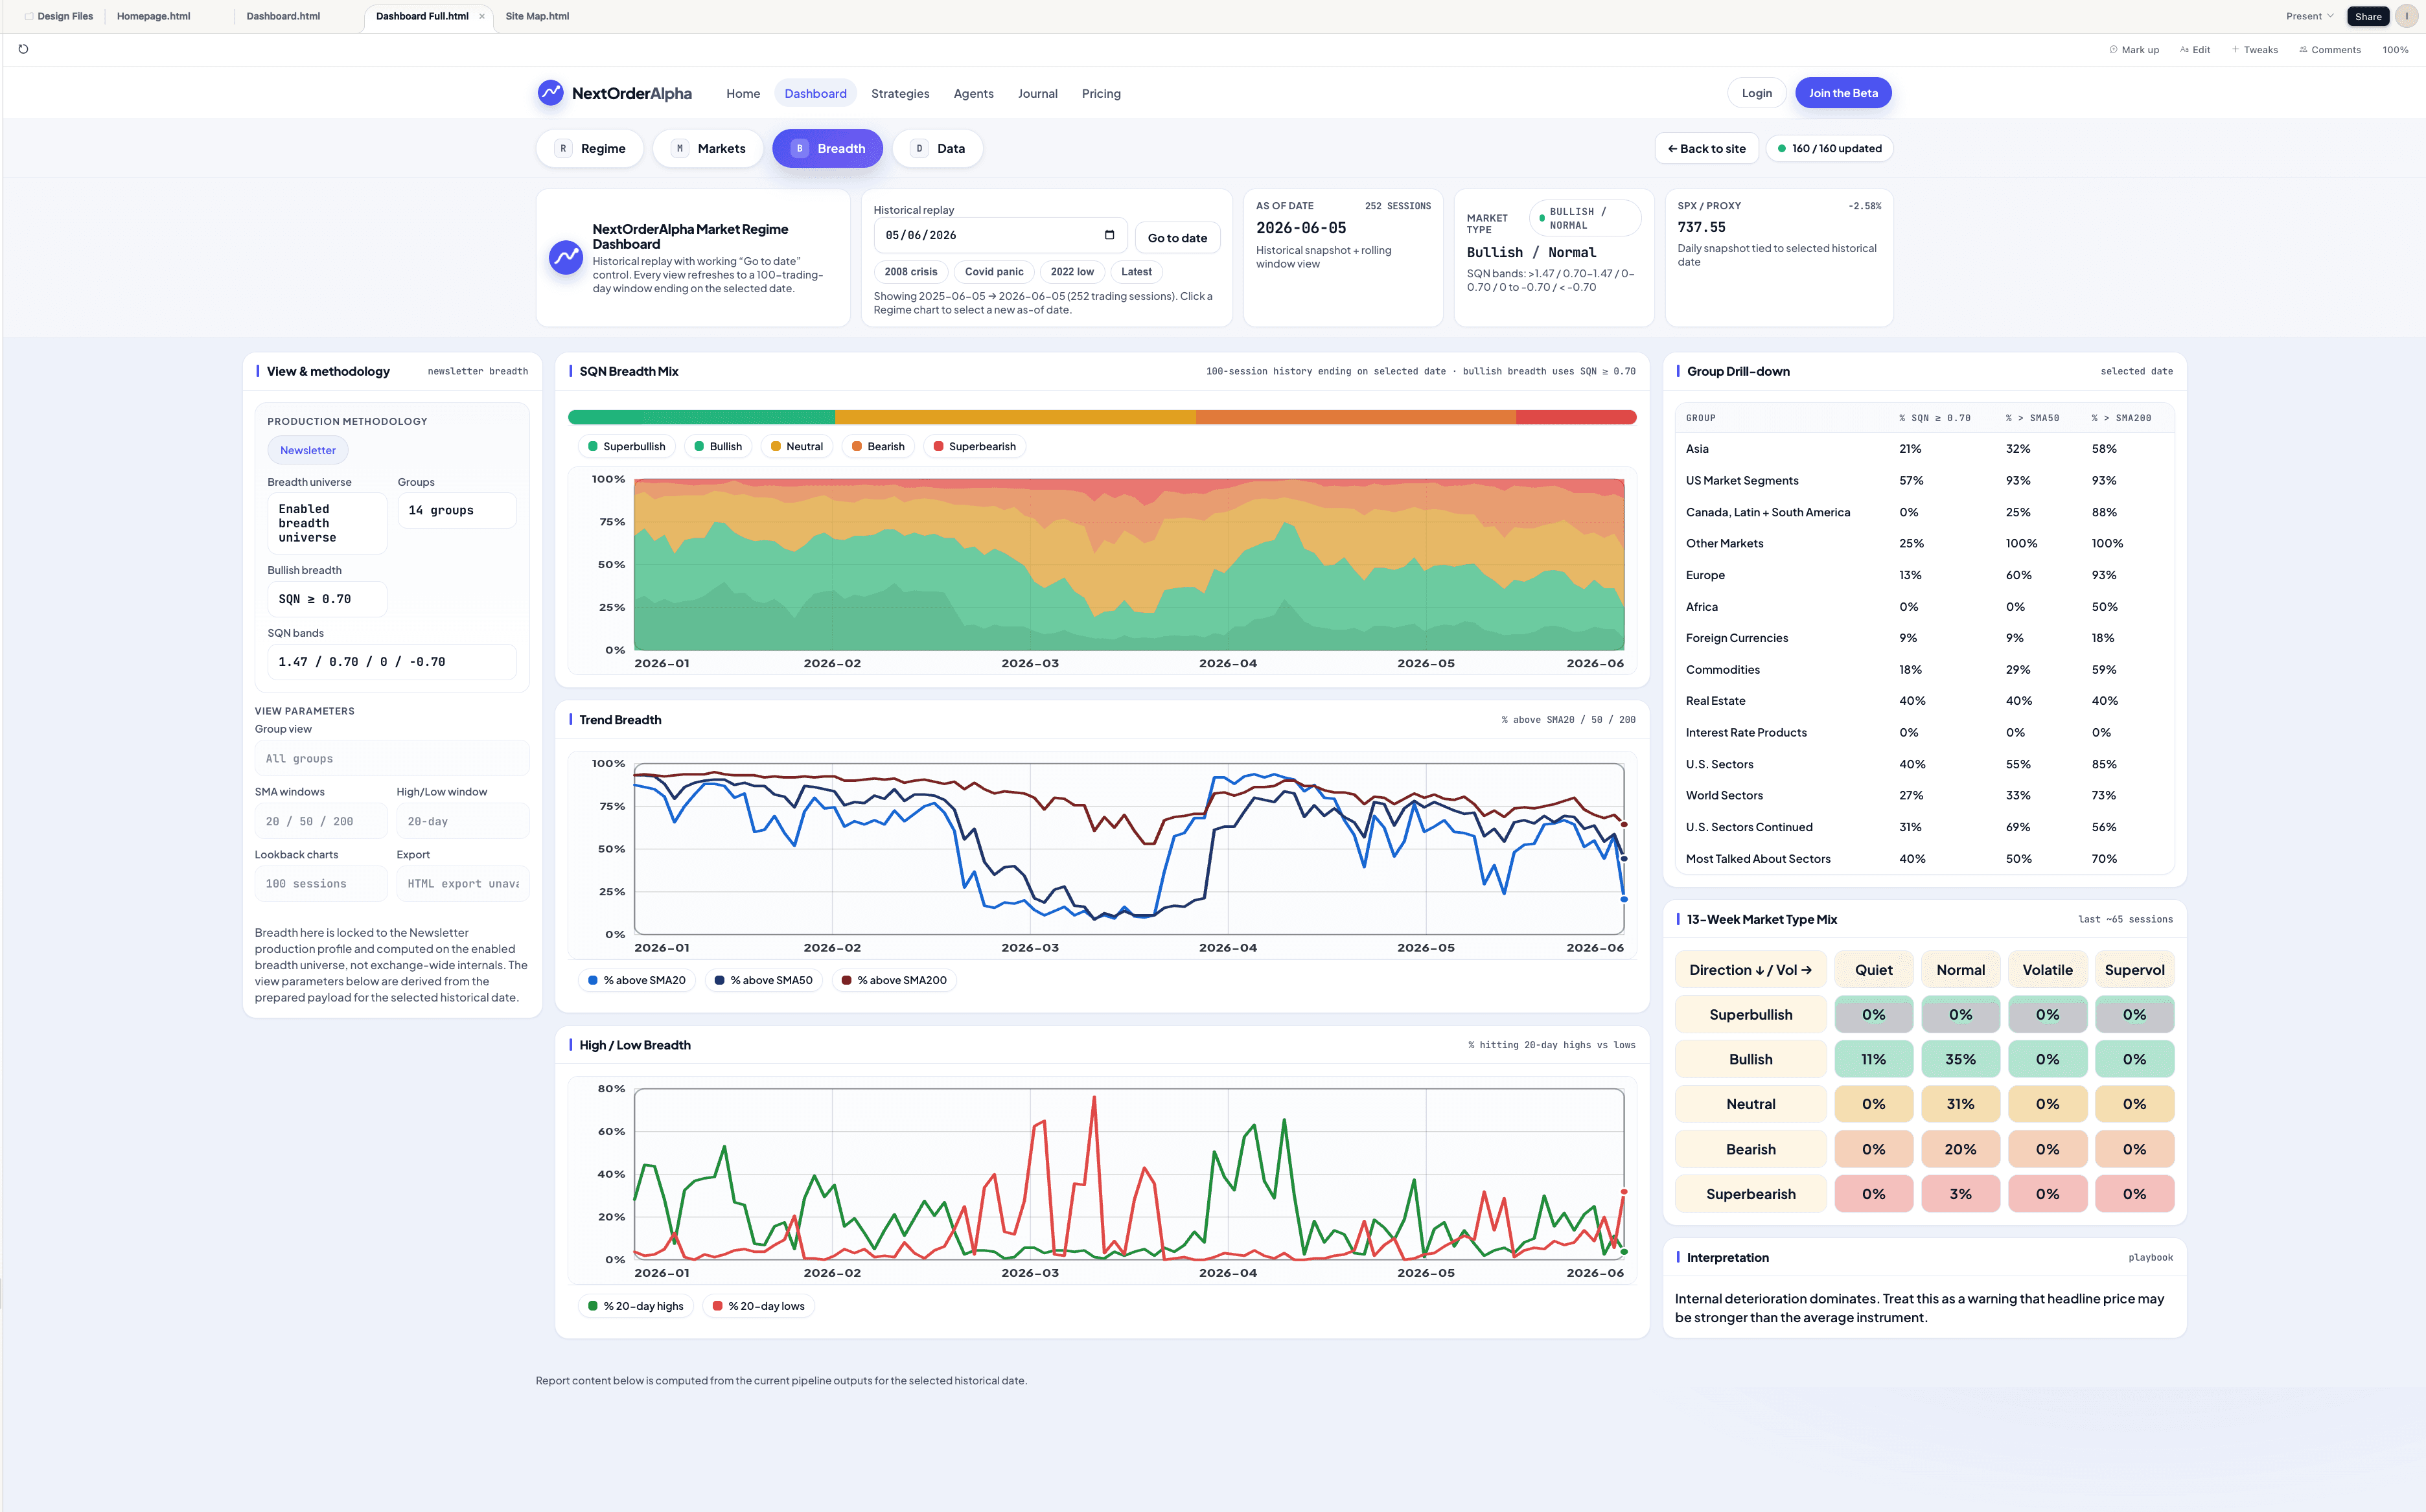
MQN breadth mix, trend & high/low.
The Breadth tab shows the 100-session MQN breadth mix, % above SMA20/50/200, the new-high vs new-low spread, and a group drill-down across all 14 market groups.
Educational market classification — informational only, not investment advice. Public data is delayed by one session.
See breadth on the live Dashboards.
The MQN breadth mix, trend internals and group drill-down — with historical replay.