Trade where the strength is.
Leadership ranks every sector, region, theme and factor by MQN — so you know what's pulling the market and what's dragging. Lean into the leaders; respect the laggards.
Leadership rides the matrix
Leaders cluster in the green
The strongest groups sit in the top-left of the matrix — high MQN, contained volatility. As a regime ages, watch leadership rotate toward the amber and red columns before the headline index turns.
| Direction ↓ / Vol → | Quiet | Normal | Volatile | Supervolatile |
|---|---|---|---|---|
| SuperbullishMQN ≥ 1.47 | Superbullish / Quiet | Superbullish / Normal | Superbullish / Volatile | Superbullish / Supervolatile |
| Bullish0.70 – 1.47 | Bullish / Quiet | Bullish / Normal | Bullish / Volatile | Bullish / Supervolatile |
| Neutral0 – 0.70 | Neutral / Quiet | Neutral / Normal | Neutral / Volatile | Neutral / Supervolatile |
| Bearish0 to −0.70 | Bearish / Quiet | Bearish / Normal | Bearish / Volatile | Bearish / Supervolatile |
| Superbearish< −0.70 | Superbearish / Quiet | Superbearish / Normal | Superbearish / Volatile | Superbearish / Supervolatile |
Live dashboard
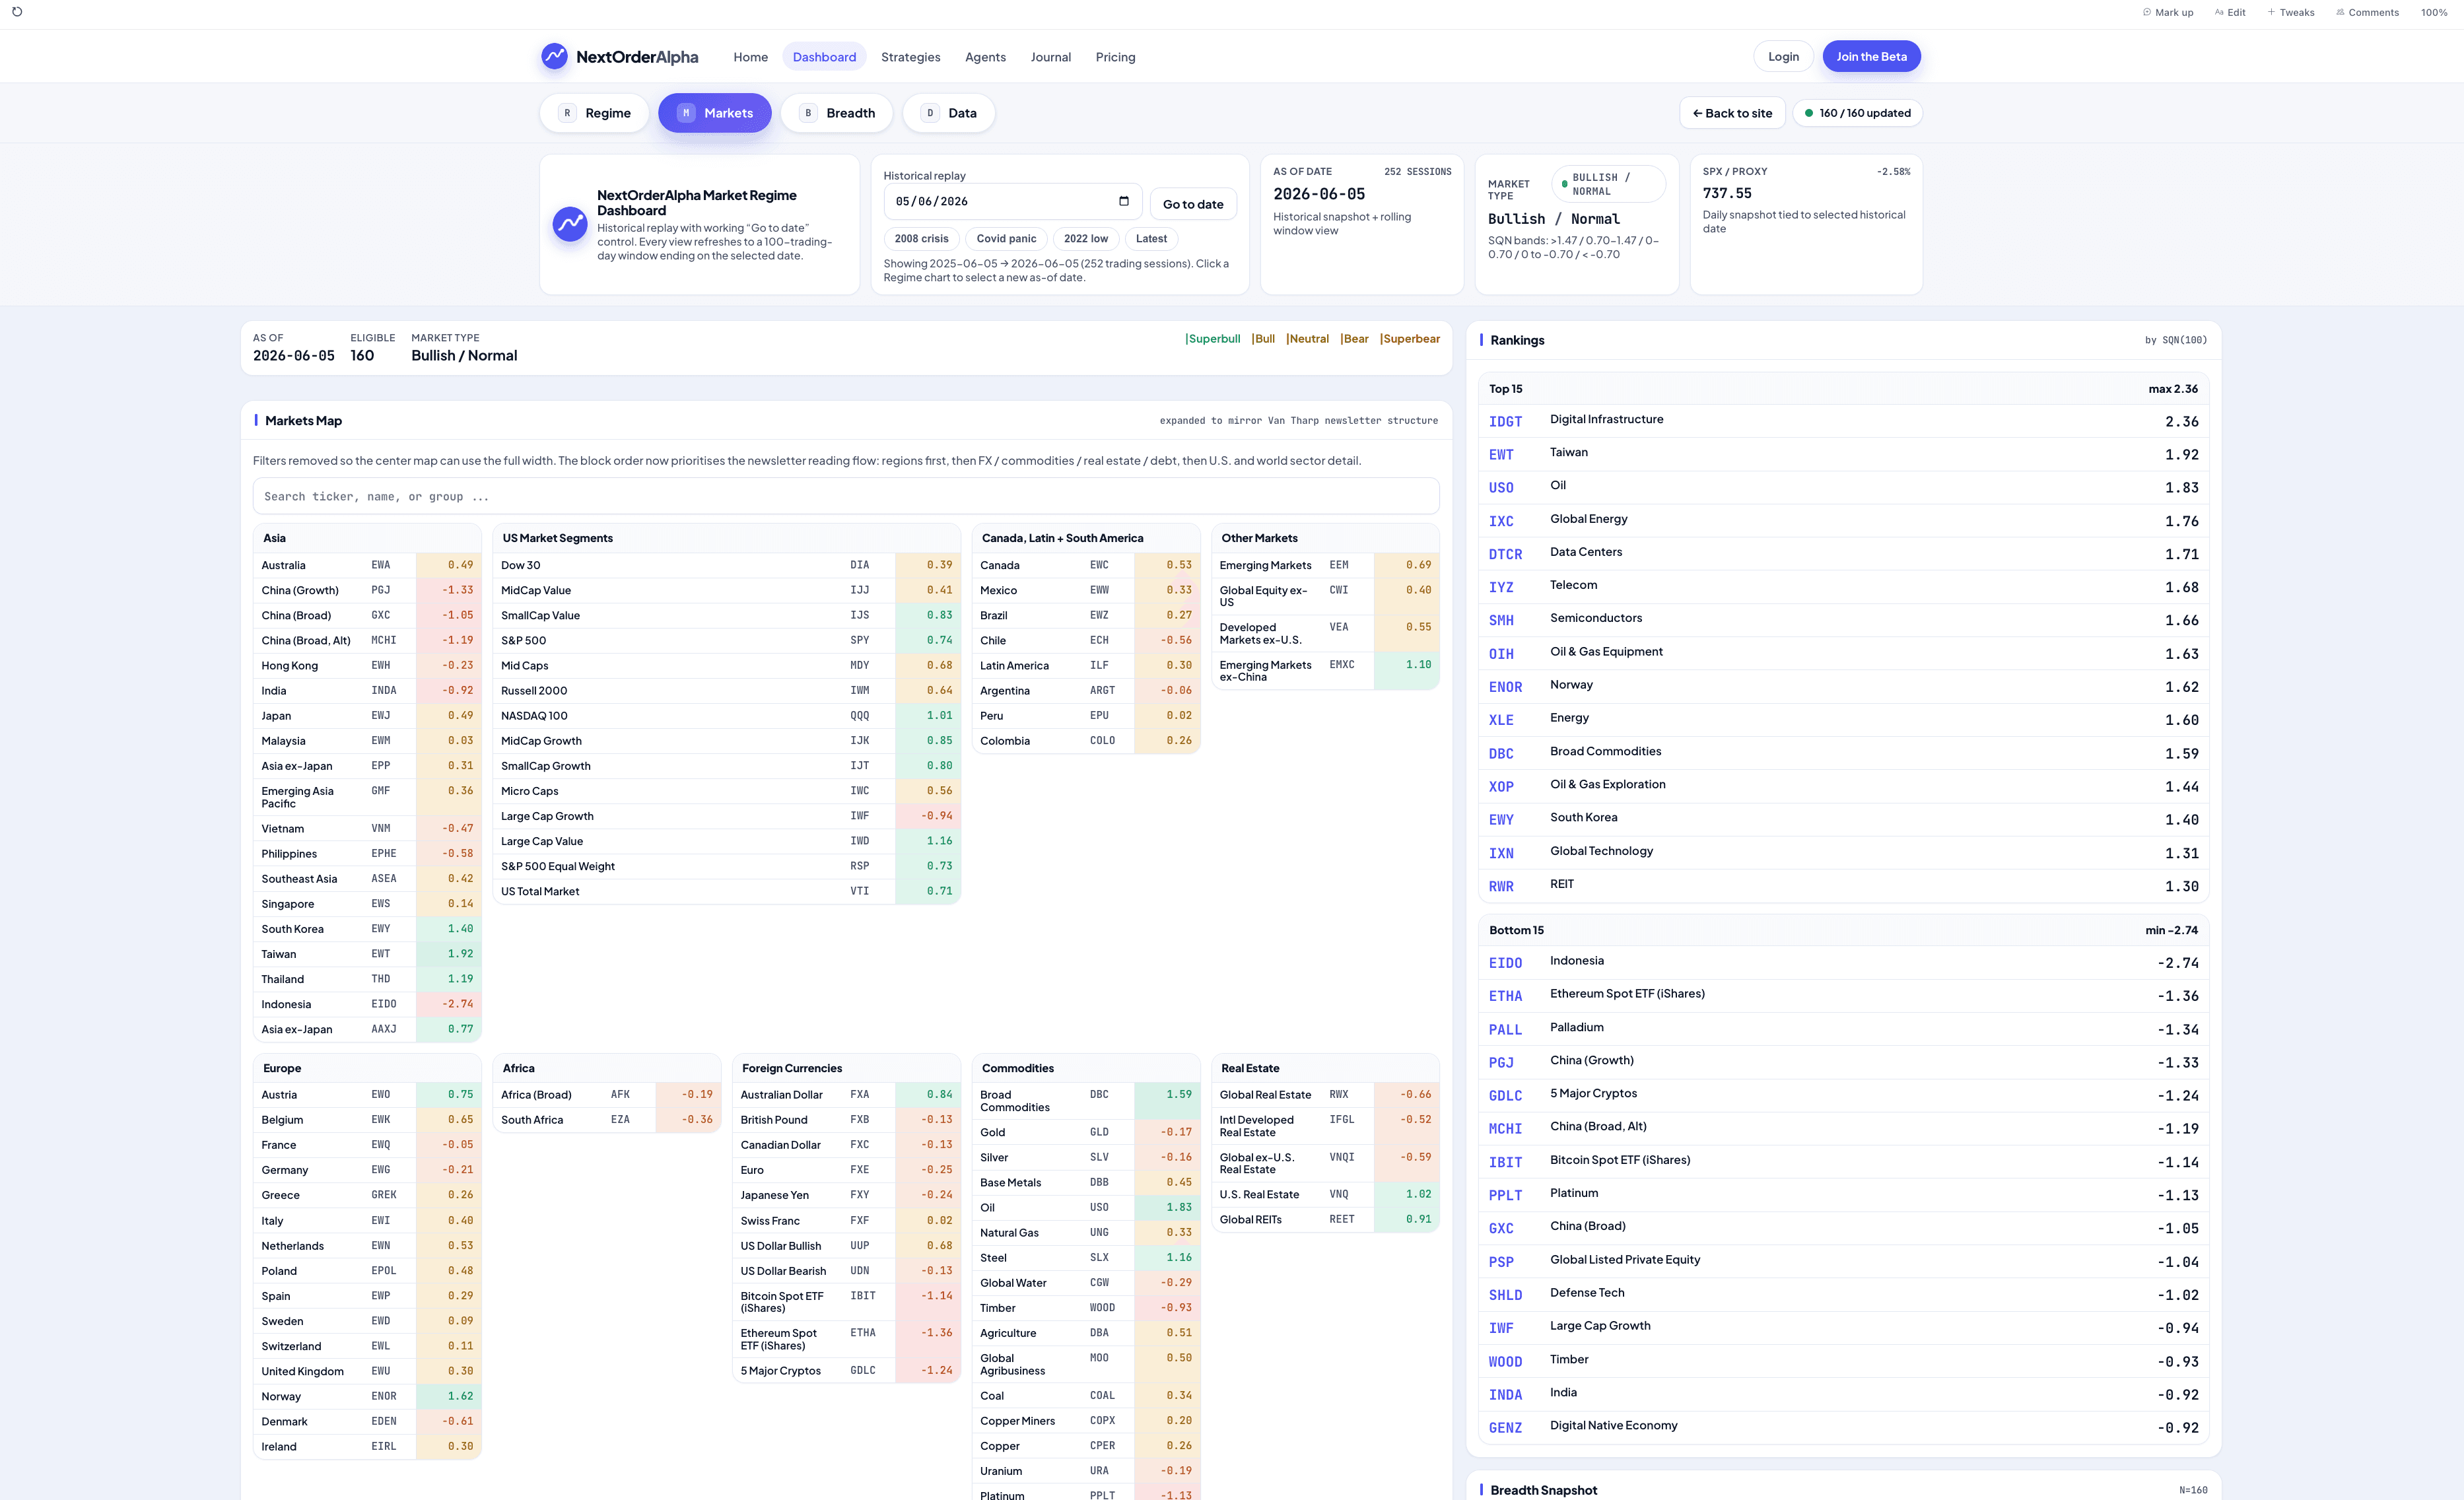
Ranked leaders & laggards.
The Markets tab ranks the full universe by MQN(100) — top 15 leaders, bottom 15 laggards, the market map colour-coded by type, and a from/until comparison to see what's rotating.
Educational market classification — informational only, not investment advice. Public data is delayed by one session.
See leadership on the live Dashboards.
MQN rankings, the colour-coded market map and rotation comparison — with historical replay.